In this article, we will learn about Performance Improvement using Database Engine Tuning Advisor in SQL Server with examples.
Need of Database Engine Tuning Advisor and SQL Server Profiler
The SQL Server performances mainly depend on how we created
the indexes meaning clustered and non-clustered indexes, etc. while creating an SP
or any query developers don't think about the indexes in the table.
By default SQL Server create a clustered index top of the primary key column and that is the only index which we have most of the tables.
so when we push these tables into the production server, for a longer time, the SQL server is not sustainable with respect to performance when
as time goes on, data increase into the table or workload increase in the table, the SQL server gives poor performance.
Approach to
creating a good database tables
So as the data increase in the production server or in a table,
then we need to think with respect to the indexing in a table we have to keep
below a couple of points for making a table.
1. Think of the data workload in production
So as per this, we have to think about the workload of data in production, which means how much of rows can insert into a table
2. Rethink indexes in a table
After collecting the data, we have to think like the default indexes which we have currently in a table are appropriate or if they may affect the performance in production. If indexes look good then it's fine and we can see something else to improve the SQL performance. If indexes are not appropriate, then we need to change the existing indexes or we need to create new indexes as per the data.
3. Create/change the indexes in the SQL server
If we see in the table that indexes are not appropriate in a
table, or not appropriate as per the table workload then we need to either
change the indexes or we need to update them.
Now collecting the SQL table data or finding the indexes of
a table is not a manual process, which means we can have hundreds of tables and SP,
and finding the data/indexes in the tables or not an easy process if we do it
manually, so we need to use tools for it.
So to find the workload of tables and indexes of tables we
have below tools
1. SQL Server Profiler
2. Tuning Advisor.
The SQL Server Profiler helps us to find the data or workload
automatically and Tuning Advisor helps us to analyze the data which is taken by
the SQL Profiler and come up with the appropriate indexes.
Note: we are
using SQL Server Developer Edition. The Tuning Advisor option is not available in the Express Edition of SQL Server.
SQL Profiler and
Tuning Advisor
So to understand it let's create two tables called student and Teacher tables and then we will insert a couple of records like below
Insert data into Teacher Table
Insert data into Student tables
In the student table we will insert more data using the loop like below, if we have a large amount of data then we see performance tuning as well.
Now if select the teacher and student records from the table
then we will see output like below
Run SQL Server Profiler
The SQL Server Profiler is a tool that helps us to find, which
type of SQL Statements are triggered on the SQL Server database.
To open SQL server profiler then go to the tools option and then
click on SQL server profiler.
Once SQL server profiles open, give the necessary information
and click on connect.
After clicking on connect you will see a window like the below ad
then click on Run
Note: - If you want to give a trace name, then you can give
Once you click on the Run button, the SQL server profiler
will start capturing lots of events, SQL Statements, services, and SPs as shown
below.
By default, the SQL server profile captures the information for
all the databases which we have in the SQL server. But we want to only capture the
information only for the CollageManagement database so for that. Close the SQL
server profile and then again open the SQL server profile with credentials and now
we basically want to do tuning for CollageManagement DB, so for that, we need
to select the tuning template below
After selecting the Tuning template, then we need to apply
some filters so that it only captures our CollageManagement database
information. Tso for that, just click on the Event Selection tab which shows
next to the General Button tab at the top. From this tab, click on the Column filters button as shown below.
After clicking on the Column Filters button, it will open the Edit Filter window. From this, select the DatabaseName option from the left
panel, and From the right panel, select the Like
option and give your database name (in my case it will be
CollageManagement) and then click on the OK
button as shown below.
Now click on the Run button. Now after this SQL server profile
will capture only our database information.
Executing the SQL
Statements:
Now let’s run the below query a couple of times
Now we can stop capturing the information by clicking on top
of the window icon
Now let’s save this record information and then we see the
performance tuning for it.
So for it, go to the Fileà
Save Asà
Trace file
And then give trace file and save it
Run Tuning Advisor:
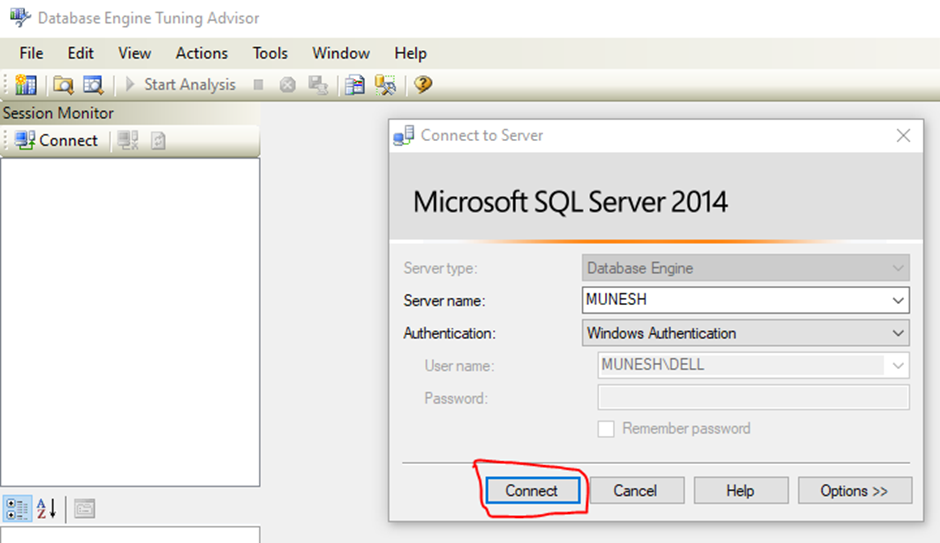
For running tuning Advisor, go to SQL server Tools and then
select the Database Engine Tuning Advisor option.
After clicking on this option, it will open a window like SQL server profiler,
there also you give credentials and click connect
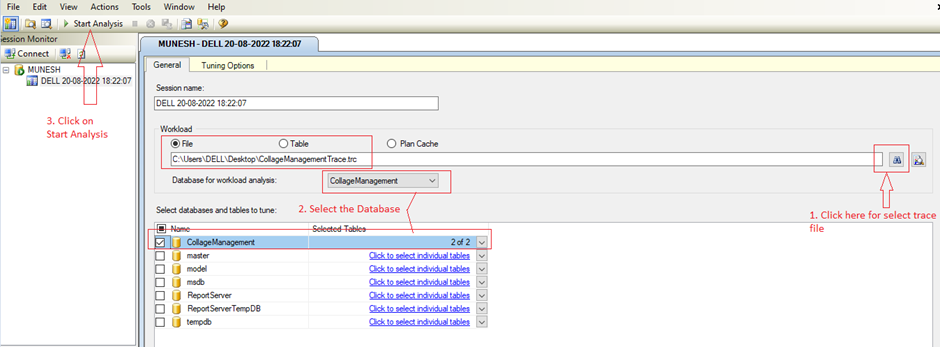
After clicking on Connect button it will open the Database
Engine Tuning Advisor window. From here select the Trace file and then selects
the database and then click on the Start Analysis button as shown below.
Once you click on the Start Analysis button, it will take some time to analyze the workload/
data and then it will show an estimated improvement and the index
recommendations as shown below.
As you can see in the above image, it suggests us to
create 2 indexes for an estimated improvement of 98%. Now you click on the
definition script for the required index.
So in the popup window, we can see, that it suggests creating
the indexes.
This is the way we can improve the SQL performance using SQL
server Profiler and database engine tuning adviser.


.png)